On 9 October 1943, the Liverpool Tidal Institute received its most challenging task to date: to calculate the optimal day and hour for the largest amphibian invasion in history, at Normandy’s notoriously unpredictable coastline. The prize was the liberation of Europe from Nazi occupation, the stakes – the lives of 250,000 Allied combatants. A scientific task of monumental intricacy at the time, this would have thrown most experts in despair. But the man reading the Royal Navy dispatch was no other than Arthur Thomas Doodson, a mathematical wizard and global authority on tidal prediction. His trusty aides were two analog tide predictors that would give any steampunk-enthusiast sweaty palms and palpitations.
The Victorian Desktop Computer
Ancient astronomers in Greece and Mesopotamia were quick to notice the connection between moon phases and tidal heights, while Chinese scholars produced accurate charts for river tides as early as the 11th century. Despite these achievements, the intricate science of tides remained a piecemeal business until Newton developed the first comprehensive model in the 1680s, paving the way for accurate predictions.
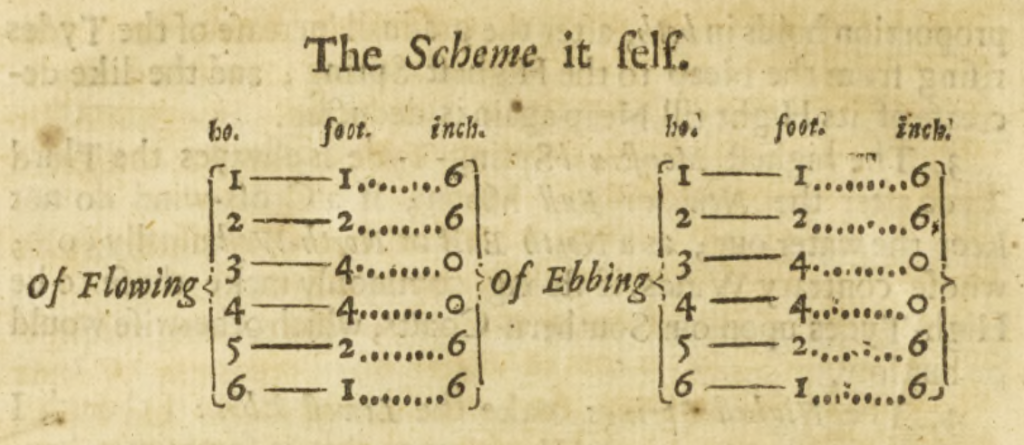
The calculations, however, were so complex with their numerous astronomical factors, that the forecast often had to sacrifice accuracy for the sake of timeliness. In other words, it was the perfect task for a computer. The pioneer in automating this process was the renowned nineteenth-century scientist William Thomson, later Lord Kelvin. In the 1860s, Thomson used Fourier Analysis to translate cumbersome hydrological databases into trigonometric functions, simplifying the calculation enough to program the algorithm into a machine.
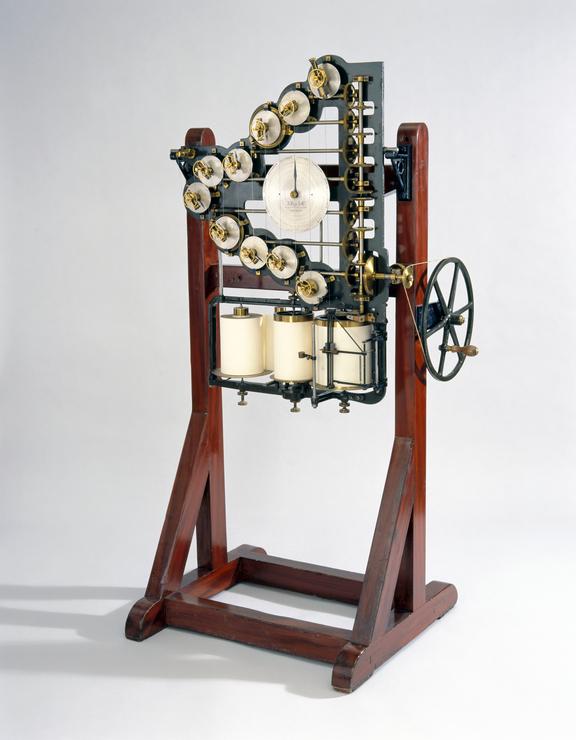
Partnering with instrument-builder A. Légé & Co., Thomson used brass, catgut, wood, and steel to construct a complex analog computing machine. Each of the machine’s ten components (consisting of pulley, gears, and shaft) corresponded to a trigonometric representation of an astronomical component (also known as harmonic constant). These included average tides, corrections for the position of the moon and sun on either side of the Equator, distortion due to shallow water, etc. The teeth of each geared shaft were proportional to the periods of the tidal components, allowing the adjustment of one function to be reflected in the remaining nine, with the pulleys releasing a certain length of cord that plotted a tidal curve on a moving roll of paper. This way, annual tidal patterns could be accurately computed for any location on earth within four hours.
Meanwhile across the Pond…
In 1881, American meteorologist and mathematician William Ferrel developed his own design, which summated 19 tidal constituents and predicted the minimum and maximum water heights, as well as their timing. Although the mechanism was more complicated than Thomson’s machine, the interface and operation were more user-friendly. Instead of continuous curves plotted on numerous heavy paper rolls, the device directly displayed the results on a dial interface, showing high tides, low tides, and time. The operator only had to turn the crank with one hand and write down the results with the other. This process produced practical tables, published annually to the benefit of the entire maritime community.
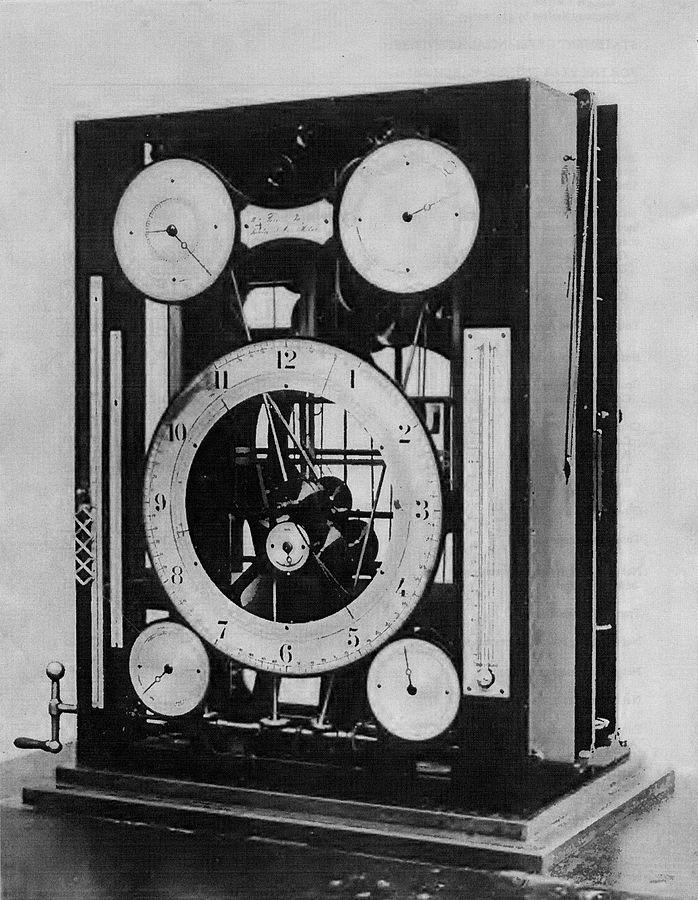
Ferrel’s second design (1910) had 37 tidal components and was affectionately nicknamed ‘Old Brass Brains’. It had a remarkable career, operating for more than five decades until its retirement in 1965, passing the baton to a digital computer.
Countdown to D-Day
Analog tide-predictors reached their zenith in the able hands of Arthur Thomas Doodson. As the Allies planned the invasion of Nazi-occupied France in 1943, tidal patterns turned out to be among the critical factors for success.
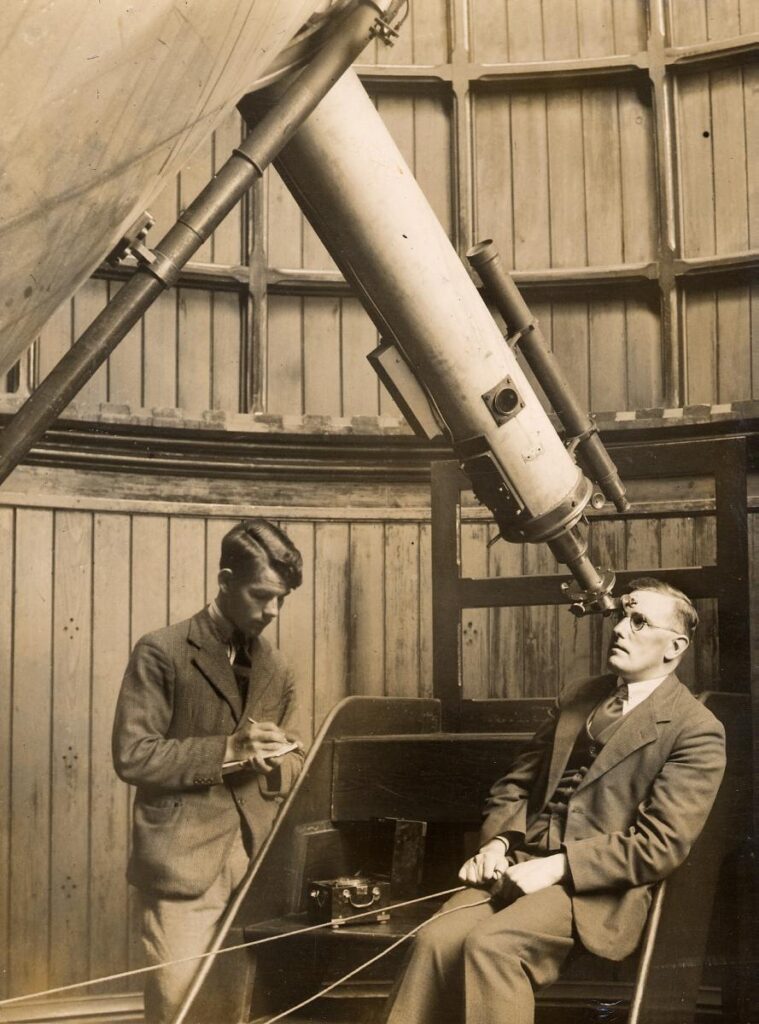
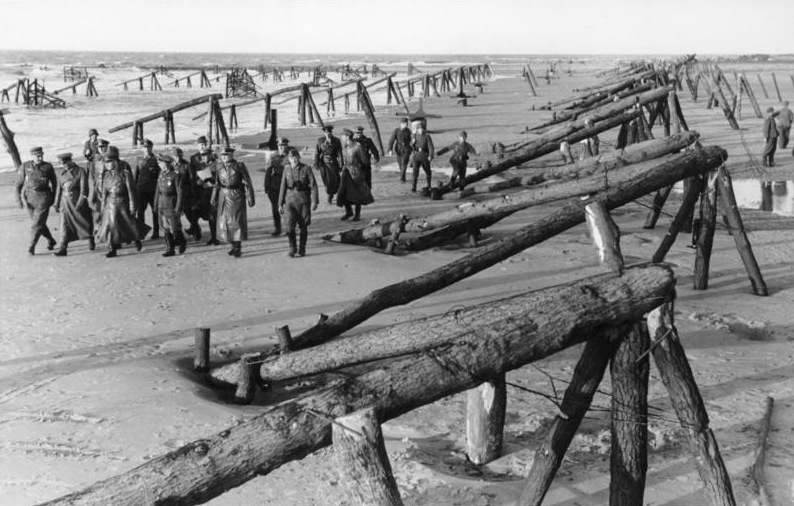
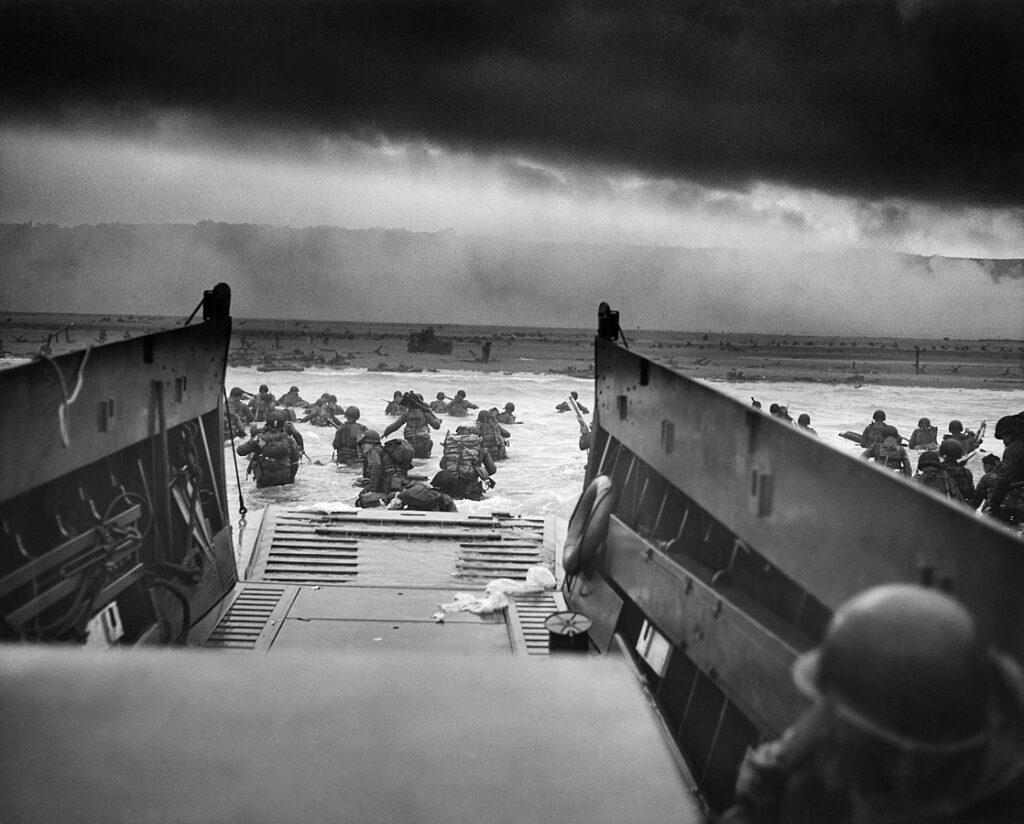
Not only were Normandy’s shallow waters notorious for their rapid and aggressive tides, but Rommel’s engineers had managed to turn them into deadly underwater obstacle-courses. To make matters worse, the operation depended on a late-rising moon, so that the Allied fleet could cross the English Channel in darkness, while the air force needed enough visibility to land paratroopers shortly before dawn. Once there, demolition teams had to wait for low tide to clear as many obstacles as possible in the brief time window before the level rose enough for landing craft to make their frenzied rush for the beaches. The men had to disembark at high tide to minimize the distance crossed under heavy fire, while the landing craft had to rush back as soon as possible before the tide receded again and left them beached.
Confused? Doodson didn’t flinch.
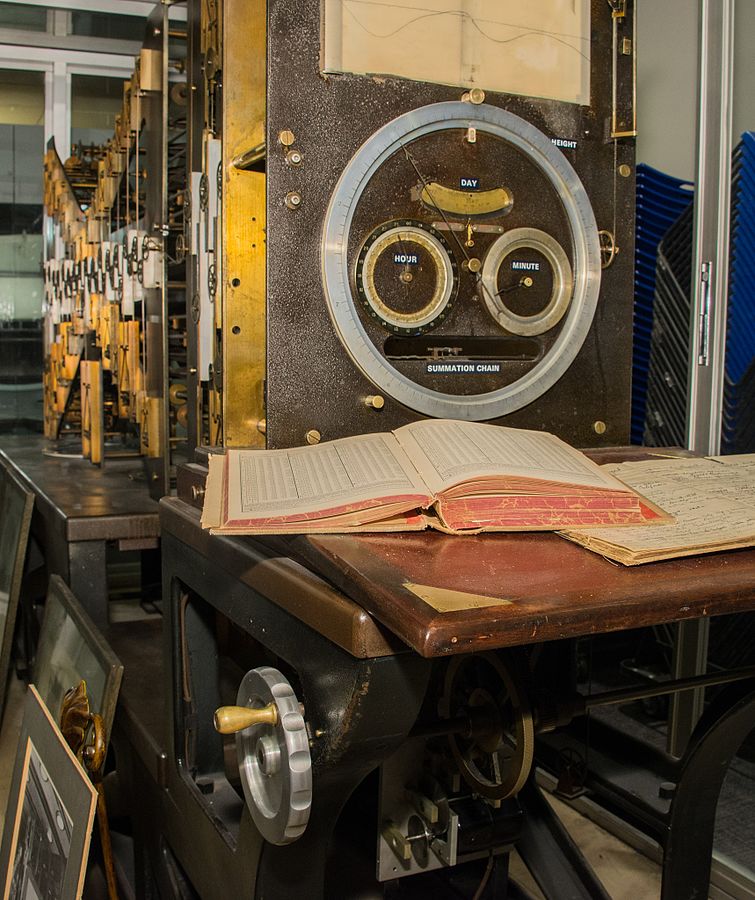
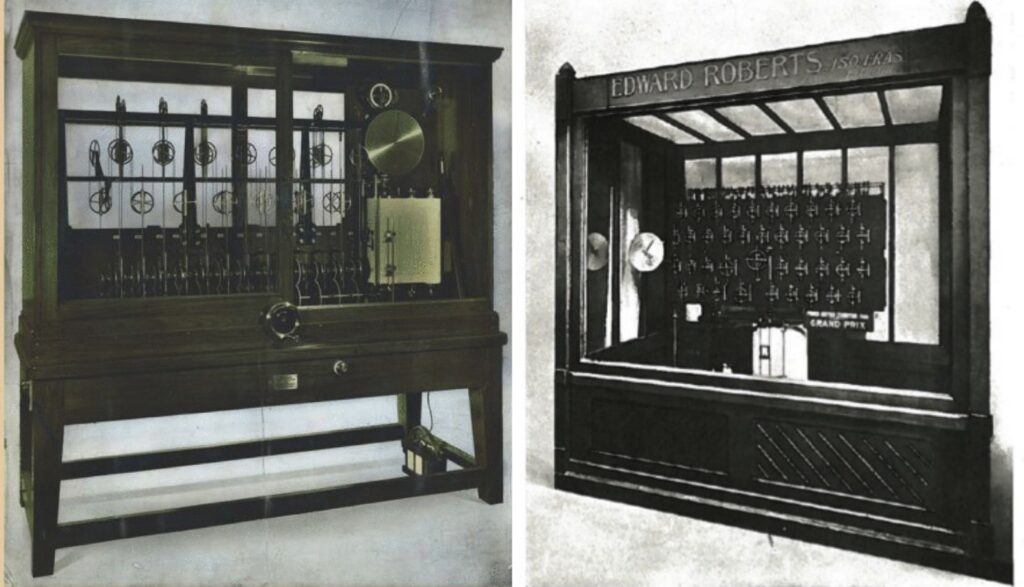
In the 1920s, the Liverpool-based scientist had acquired two of the best computing devices of the time – the ‘Bidston Kelvin’ machine from 1924 and the ‘Roberts Légé’ machine, built in 1906 and refurbished in 1929. Despite its advanced age, the ‘Roberts Légé’ was a superior device, able to process 40 constituents, compared to the 29 of the brand-new ‘Bidston Kelvin’. Regardless of technical specifications, though, it was Doodson’s mathematical brilliance that helped extract more value out of these machines than their creators could have even dreamed of.
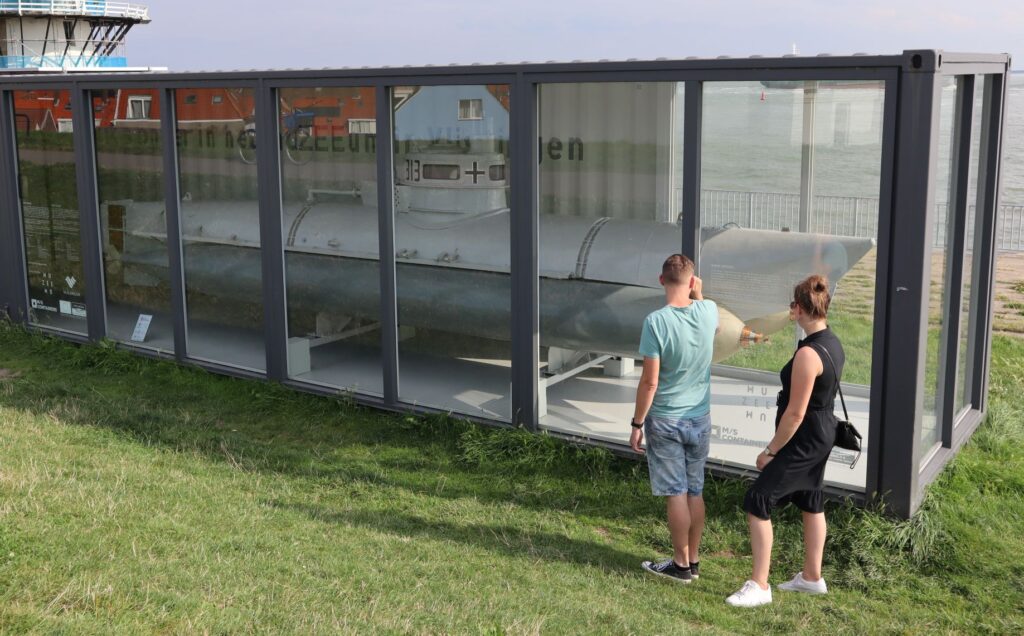
But the biggest problem with setting a date for D-Day was not the processing capacity of people and equipment. The Allies simply had no raw data on the five locations selected for the amphibian landing, while inferring these parameters from nearby ports was almost useless with the variations of water depths along the coast of Normandy. The unenviable mission to gather the missing information landed on the desk of William Ian Farquharson – a Royal Navy commander, expert hydrologist, and spymaster by necessity. He resorted to perilous clandestine operations, sending commando boats and midget submarines to collect measurements at various beaches in Normandy, all in the dead of night. Farquharson eventually scraped together 11 pairs of harmonic constants, which he sent to Doodson in October 1943, labeling the result of his own excruciating efforts as ‘gambling’.
It was a gamble that paid off. Even though the amphibious assault of 6 June 1944 succeeded at the heavy cost of 4,414 confirmed Allied deaths, historians and military experts estimate that without accurate tide predictions, these numbers could have been well into the five-figure range. The proof – Omaha Beach alone accounted for half of the casualties after tide miscalculations left the landing craft stranded. The troops had no choice but to slog through neck-deep water under the hellfire of German artillery, while more than half of the engineers perished in desperate attempts to clear obstacles. In stark contrast, gaining control of Utah Beach came at the cost of 197 lives, although we must note that hydrographic accuracy was only one of many factors for success.
Living Heritage
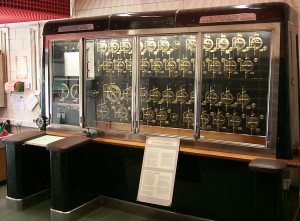
Several tide-predicting machines can still be seen around the world, although the digital revolution has reduced them to museum curiosities. Lord Kelvin’s 1872 device is exhibited in London’s Science Museum, while Ferell’s Old Brass Brains is still in working condition at the NOAA’s facility in Maryland. The American’s original invention of 1882 is on display at the Smithsonian National Museum of American History in Washington, DC. Enthusiasts can also visit the Deutsches Museum in Munich for a unique German design, which was kept top-secret until the end of World War II. But above all, Liverpool boasts the most impressive collection – both the legendary ‘Roberts Légé’, as well as Doodson’s own state-of-the-art electric machine, the most advanced analog tide predictor before digital computing took over in the 1960s’.
The Shipyard

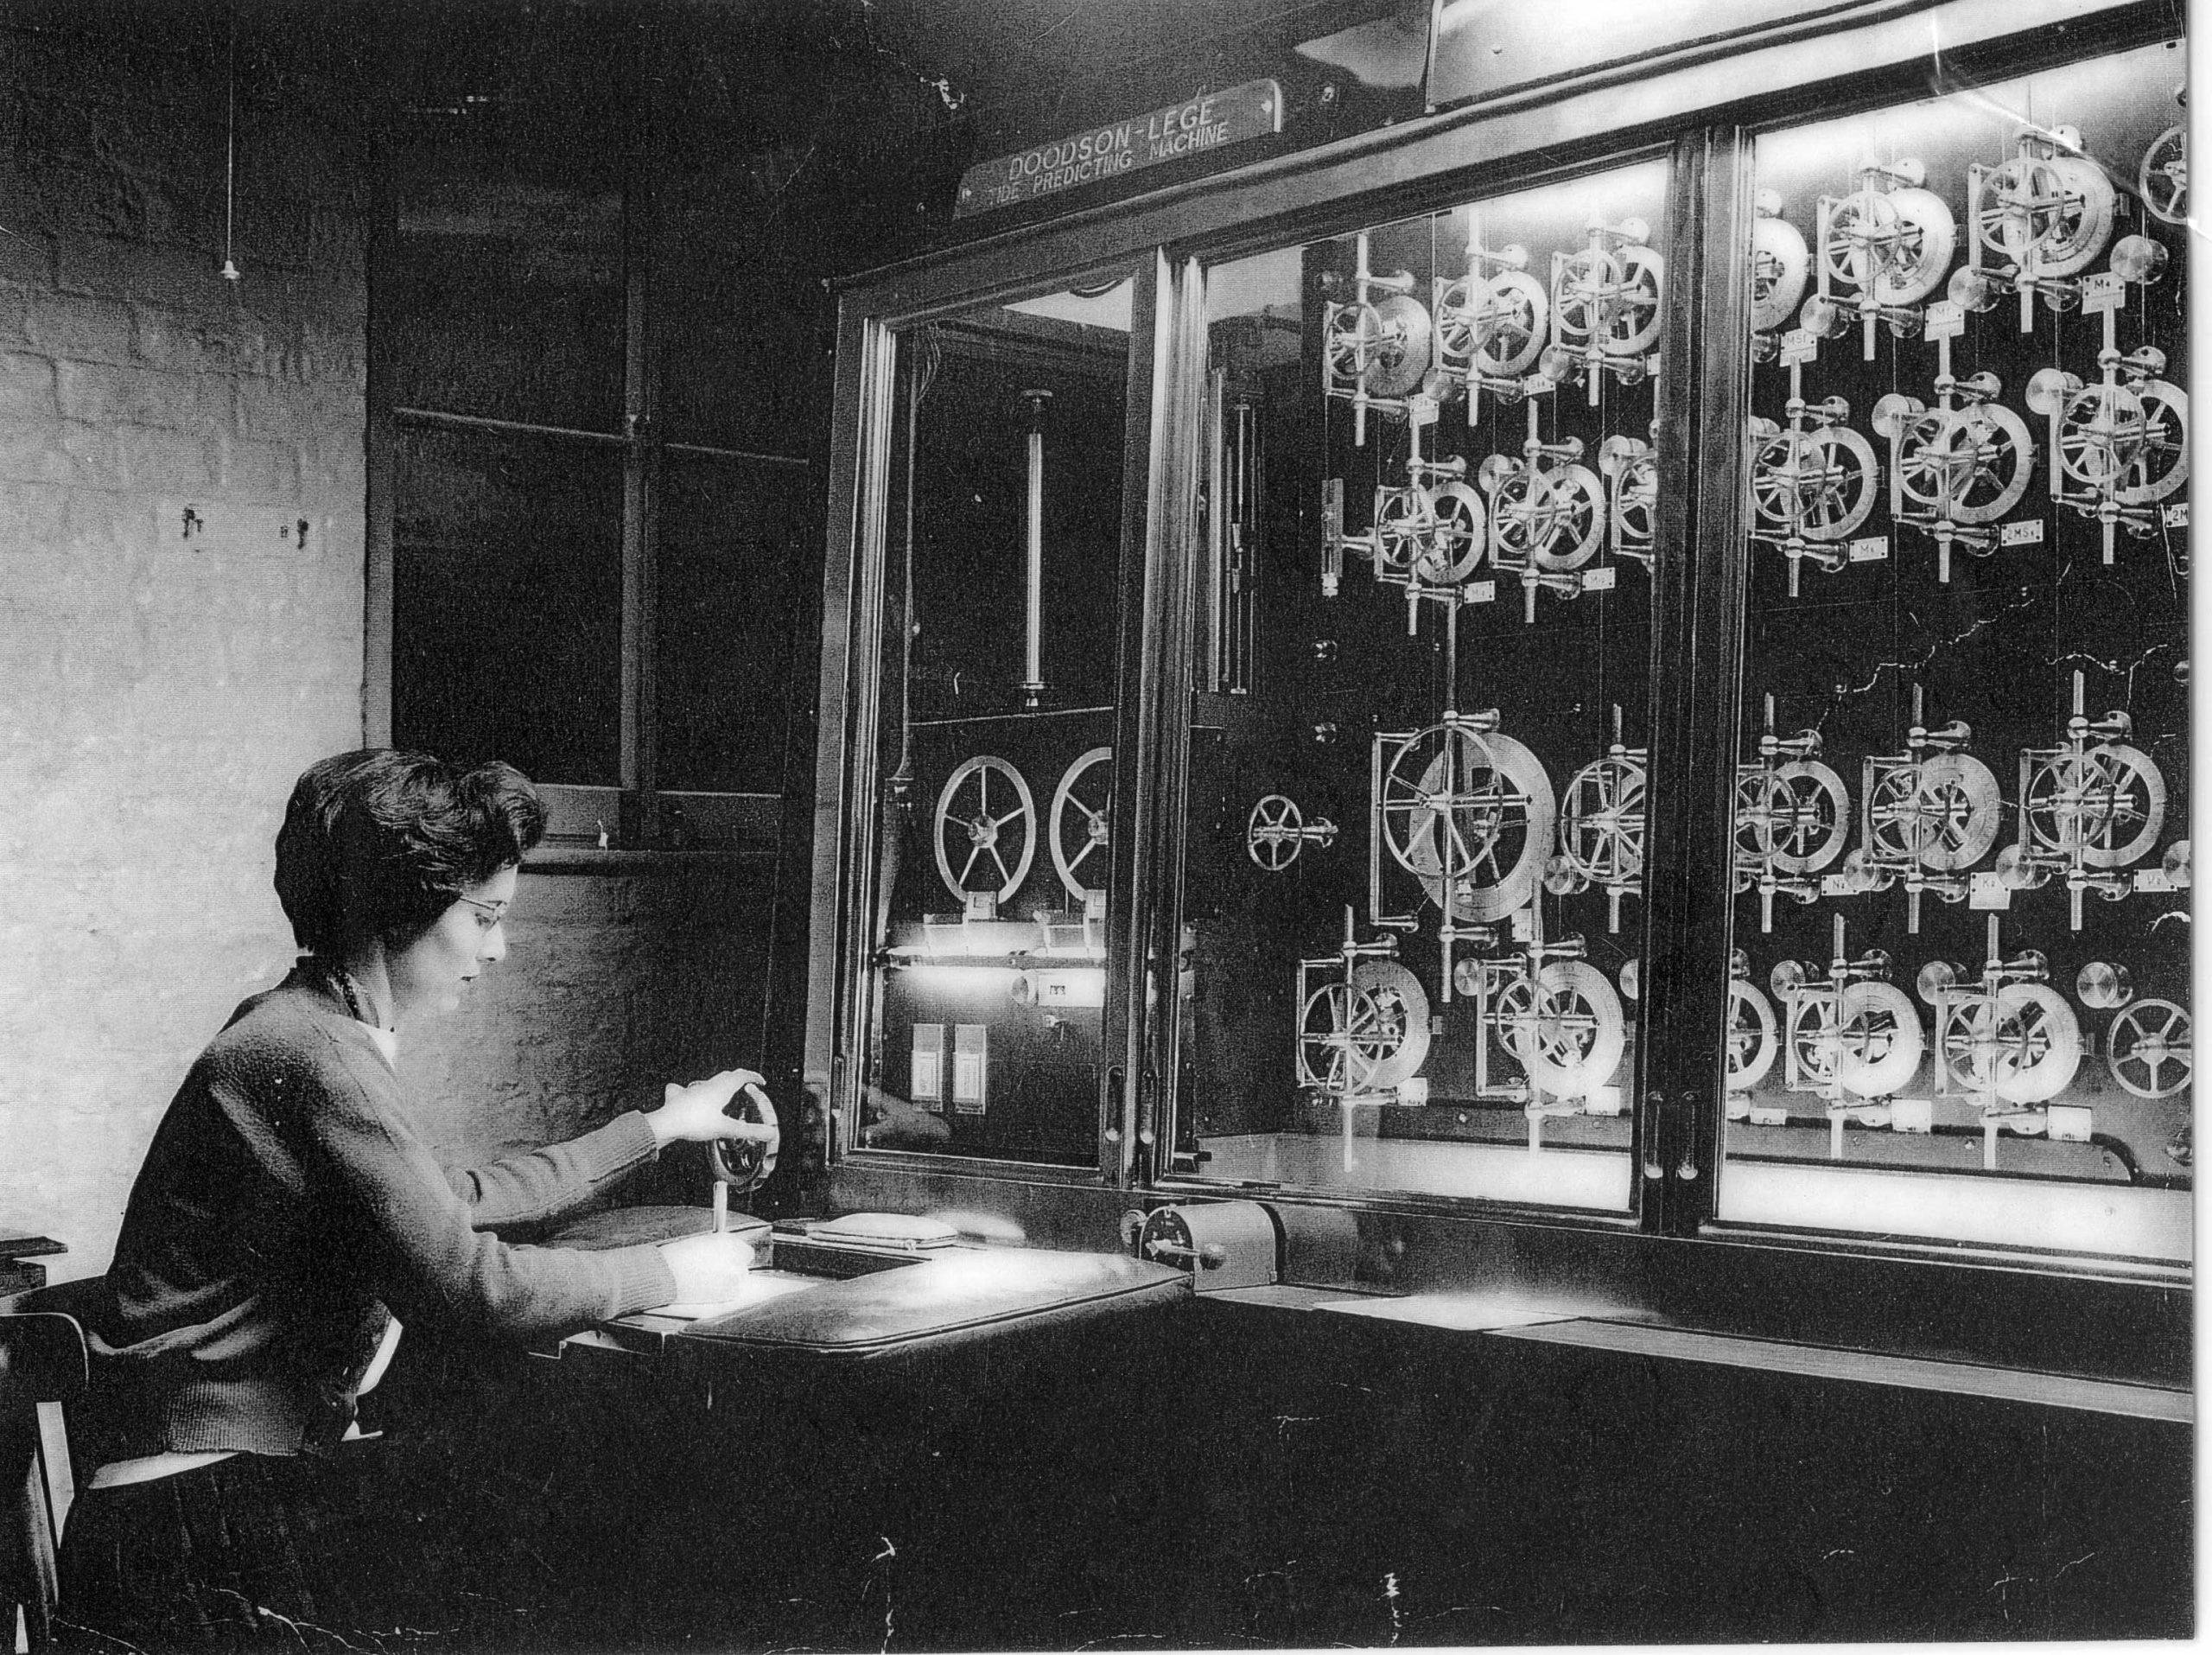
This is very nice to know about earlier contributors for tide measurements and predictions…We have one Doodsan-Lege Machine in our museum but no photograph of Mr Doodson. But you posted a photograph in blog…appreciating you
Happy to hear that! Which museum is that?